

Live-Testing Critical Systems at Scale
How Nominal reduced streaming latency by 30x
When a Nominal customer runs a major test event, split-second decisions can determine success or failure. Engineers conducting safety-critical tests need to monitor live data in Nominal to decide whether to continue, pause, or abort.
Today, the Nominal Core platform enables teams of engineers to monitor high-scale systems in real-time in no-fail environments. Delivering that level of responsiveness demanded a re-architecture of our streaming pipeline, and set us on a journey to cut latency by orders of magnitude.
This post shares how we did it and what we learned during that process. It is the first in a series about how Nominal developed its real-time streaming architecture.
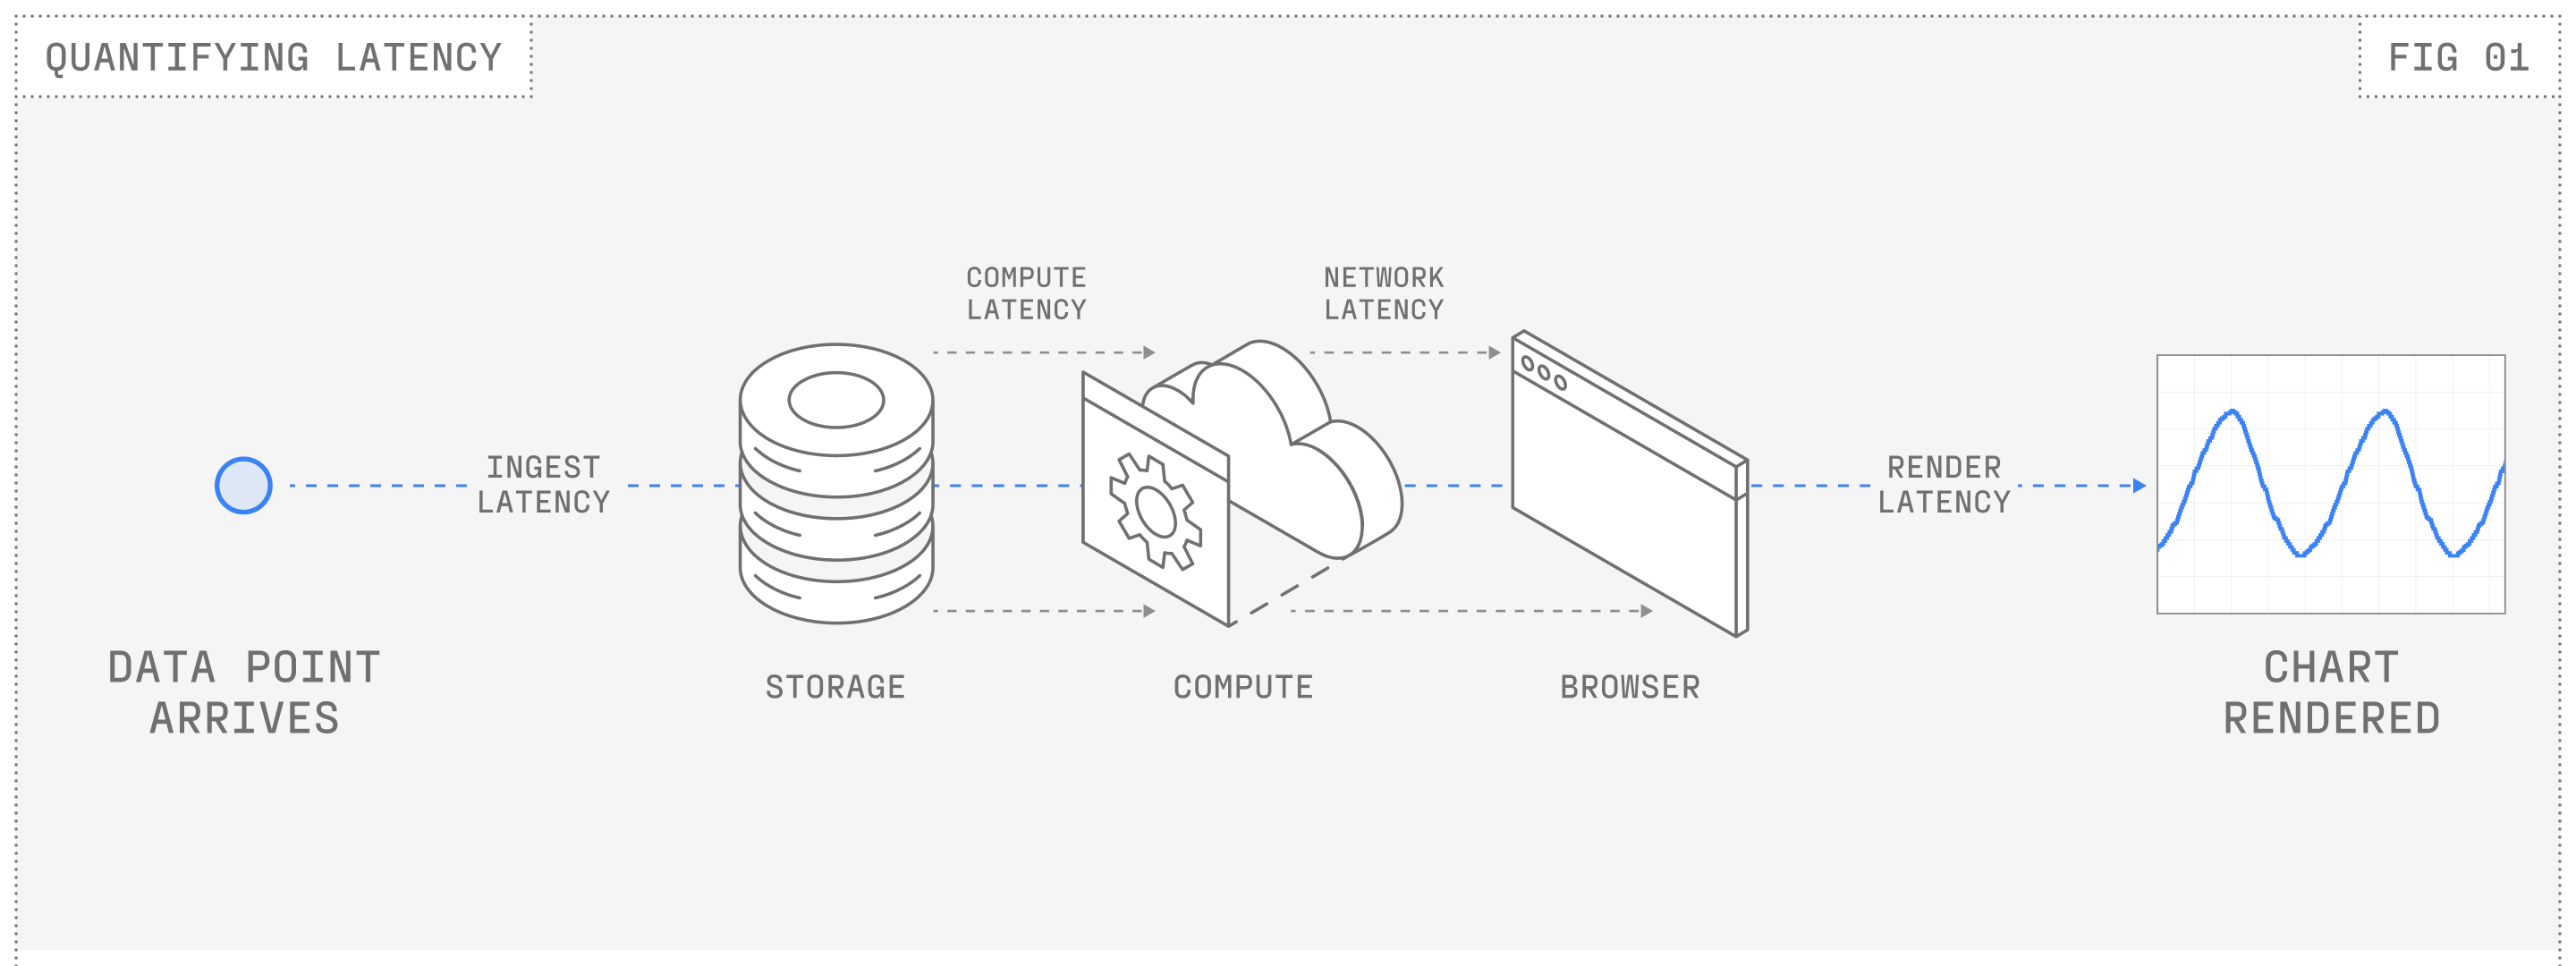
Quantifying latency
The first step to tackling performance is to quantify the slowness. A report of slowness from a customer could mean any number of things. How and where is it slow? What part of the system is slow? What are the user’s network and hardware conditions?
A data point that is streaming into Nominal will pass through several layers before a user even sees it in their browser. Latency can (and did) exist at every layer, so before we could start optimizing, we needed to accurately instrument the slowness.
In examining the life cycle of a data point in Nominal, we were able to break down and quantify the latency from 4 key sources:
Internal Ingest latency: Time it takes to store data Nominal receives in internal data structures.
Compute latency: Time it takes to run any requested computation over the new data.
Network latency: Time to deliver the data over the network to the browser.
Render latency: Time to process the data and render the points on the screen.
Working backward from a target customer’s needs, we set an end-to-end p99 latency goal of 500 ms for an upcoming test campaign. That target covered the full journey from sensor readout through upload, compute, validation, and visualization.
With those baselines in place, we identified bottlenecks and started tackling the biggest contributors to latency: ingest and compute.
Cutting ingest and compute latency by 100×
Our instrumentation showed that some of the biggest gains to be had existed early in the pipeline, in the ingest and compute stages of the data.
Hot vs cold storage path
We determined quickly that writing directly to durable storage introduced major delays. Durable storage is essential for reliability and historical analysis, but we couldn’t afford to block the live streaming path on it.
Our solution was to bifurcate the ingest pipeline into two paths:
Cold Path: Writes to durable storage for long-term reliability and analytics (always).
Hot Path: Writes to an in-memory buffer optimized for real-time streaming (on demand).
The hot path is activated only when a customer starts live-streaming data in Nominal, keeping only recent data in memory. This avoids the prohibitive cost of writing all ingested data points to both paths. The bifurcated pipeline allows us to achieve both durability and efficiency: we maintain reliable, historical storage without sacrificing the responsiveness required for live-streamed data.
Creating the hot path reduced our p99 ingest latency by about 99%, from over 5 seconds to about 50 milliseconds.
Incremental computation
In Nominal, our compute engine enables users to perform time series transformations, derivations, and aggregations in real-time.
Our compute engine was originally optimized for evaluating the full window of data that a user was viewing. That worked when streaming small datasets, but when streaming at a scale of hundreds or thousands of high-frequency channels, constantly computing the full window became prohibitively expensive.
To avoid recomputing the whole window, we switched to incremental compute: the system computes only the new points since the last update, and sends them as append-only updates to the browser. This allowed us to skip repeatedly re-running queries on points we have already seen, dramatically improving our scaling factor.
Push based architecture
Our initial streaming design relied on polling our compute APIs for new data. This worked at low frequencies but broke down under high-rate streams. Each poll introduced more network latency, compute wait time, and round-trip overhead.
Instead, we switched to a push-based architecture using websockets. With this change, an end user’s browser opens a persistent connection, and the backend streams new points as soon as they’re available, without waiting for round-trip requests instantiated by the browser.
Combined with incremental compute, the websockets lowered our latency significantly. Performance became limited by how fast the frontend could draw data, not by how fast the backend could send it. That’s a good problem to have!
Rendering performance improvements
Once data could stream to the browser as fast as the backend could deliver it, the next challenge became rendering. At high frequencies, the browser attempts to process and draw tens of thousands of points per second, becoming the bottleneck.
Offloading work to background threads
In early testing, we found that if the main thread handled very high-frequency websocket messages directly, it became completely saturated with just processing messages. This left the main thread no time to actually draw new points or respond to user interactions.
To process the high-frequency data, we added a web worker that would handle the websocket connection and resulting messages. The worker is then responsible for sending the data to the main thread in a throttled cadence, which gives the main thread a chance to breathe.
Reducing message overhead
Adding a worker introduces a new tradeoff: serialization and deserialization overhead from postMessage. The more data flowing between threads, the slower the messages send and receive – on the order of seconds!
Our earlier switch to incremental appends provided a natural fix: messages to the main thread scale with the amount of new data, not with the total data in view. Instead of constantly redrawing the full window of data, the UI only needs to process a few seconds worth of points at a time, an order-of-magnitude speedup all by itself.
To apply appends seamlessly, we “stitch” new data into existing buffers at multiple layers:
Web worker: Since we only tell the main thread about new data in a throttled fashion, we accumulate and stitch together appends for some number of milliseconds before sending them to the main thread.
Main thread: Once the main thread receives the accumulated appends, we stitch them into our existing data cache while also garbage collecting data that is no longer in the streaming window.
Rendering: We use canvas to draw our time series charts, so we also stitch new points onto the canvas instead of redrawing all points each frame.
All together, these improvements brought our median latency well under our initial target and sped up our streaming pipeline end-to-end by about 30x.
Reducing tail latencies & high percentiles
With our median and p95 latency consistently now orders of magnitude faster than when we started, our focus turned to the rare cases. Occasionally, we saw our p99 latency spike very high, sometimes as bad as 10+ seconds. These are rare, but unacceptable for critical live test environments. To eliminate them, we focused on two culprits: infrastructure interruptions and cold-start behavior.
Root causing latency spikes
Nominal deploys its software continuously, meaning that our Kubernetes pods regularly roll over and restart. When a pod rolls, existing WebSocket connections would be terminated and the client would reconnect. However, in our testing we found that new pods often incurred a high startup latency. Some of this latency came from the JVM warming up (class loading and just-in-time compilation), but we also saw overhead from hydrating historical data, checking permissions, and initializing compute.
During rolling upgrades, these cold-starts would compound: multiple pods restarting in quick succession meant users could experience reconnects that took several seconds, which was far too long for critical test events. We needed a way to make pod transitions invisible and non-interruptive to users.
Graceful Pod Termination
We implemented graceful termination using Kubernetes lifecycle hooks: when a pod receives a SIGTERM command to notify the pod that it will soon be shut down, it notifies its connected websocket clients that the connection will also close. Upon receiving the notice, the client proactively opens a new connection to an available pod and waits for this backup websocket to fully initialize before switching client traffic over.
This approach allows seamless handoff between pods, allowing Nominal engineers to roll deployments and upgrade services without interrupting live tests.
Reducing cold-start latency
Although graceful termination mitigates issues during planned restarts, we still needed to handle unplanned failures, when we are unable to forewarn streaming clients that the pod is about to roll or when the websocket disconnects for some other reason. When the frontend tries to reconnect in these scenarios, we found that the biggest latency contributor was due to cold-start latencies in the JVM.
To fix this, we added JVM warm-up tasks that execute critical code paths upon start-up and before a pod declares itself ready. This ensures that no user traffic is routed to a pod that would have previously incurred a high startup cost. The warm up tasks lowered the p99 spike during unplanned failures from upwards of 10 seconds to about 1 second.
Resiliency and correctness with out-of-order data
With latency stabilized, our next priority was correctness: ensuring every point delivered to the browser is accurate, even when data arrives out of order.
In live tests, data can arrive out of order due to unreliable networks or natural parallelism in our ingest pipeline, and Nominal has to stay both fast and faithful to the source.
Guaranteeing data correctness in real time
To minimize latency, we biased towards sending points whenever we receive them. Unfortunately, this opened us up to receiving points slightly out of order, sometimes due to parallel ingestion, other times due to network jitter.
Another interesting example of out-of-order data is satellites, which only stream when in contact with a ground station. If that contact window is brief and bandwidth is low, the satellite might only send the highest priority data, meaning that current data often arrives through the stream before historical data.
Ensuring perfect ordering across every channel would require global locks and buffering, which would destroy the responsiveness our users depend on. Instead we guarantee eventual consistency. The frontend gracefully handles out-of-order data by stitching overlapping appends into the existing buffer, giving preference to newer points.
For points that arrive more significantly out of order, the system periodically performs a full re-fetch of the active time window, similar to how video streams mostly send just the changes between frames, but periodically send full keyframes as a full refresh of the image.
The result is a stream that feels instant yet (eventually) accurate. Every update eventually converges to the correct timeline, like a movie being streamed live to the test engineers watching it in Nominal.
Network resiliency
Our customers test in every environment imaginable, from wired lab benches to airgapped environments to airborne telemetry over Starlink. We designed Nominal’s streaming layer to adapt dynamically and performantly to these conditions.
In our previous poll-based architecture, we had natural back-pressure when the browser asked for data, since we could control how many fetch requests were in-flight. In a push-based architecture with the websocket, that natural back-pressure goes away. That’s great if your network can keep up, but less great when it completely saturates your network bandwidth, which slows everything (and everyone!) down.
Since we cannot predict what the network conditions are going to be like for every specific deployment, the backend and frontend send ping and pong messages to each other once connected, measuring the latency of the corresponding pong received from the other system. Each side will then use this measured latency to determine whether the connection is healthy or backed up.
If the frontend detects rising latency, it dynamically requests a slower and slower message rate from the backend until it knows it can keep up.
If frontend latency crosses a critical threshold, it re-creates the websocket entirely at a lower message rate.
If the backend sees too many unanswered pings, it pauses sending messages to the client or closes the socket to force the frontend to reconnect.
In testing, we found that resetting a congested socket and reconnecting at a slower rate was often faster than waiting for it to recover. We also built in automatic message frequency stabilization: once recovered and stable, the frontend will cautiously ramp message frequency back up until it reaches the optimal throughput for that user’s browser.
This adaptive strategy ensures low-latency streaming remains usable in every environment: fast networks stay fast, and constrained networks stay reliable rather than collapse under load.
Conclusion
Together, these optimizations made Nominal’s streaming pipeline faster, predictable, and more resilient, even under extremely demanding real-world conditions. We can roll upgrades mid-test without disruption, recover from failures in milliseconds, and adapt to networks anywhere from fiber to Starlink. We also laid the groundwork for further improvements to handle data scale several orders of magnitude higher than our original target.
Our next focus is extending these guarantees to multi-modal data and edge environments as we continue refining Nominal’s real-time capabilities, continuing to make Nominal a platform engineers can trust to deliver truth instantly.
 |
|