

Modeling satellite constellations using ephemeris data
Nominal Connect: Build precise 3D visualizations without losing velocity
Modern aerospace visualization needs more than static lines and flat maps. With expanding constellations in LEO (low-earth orbit) and MEO (medium-earth orbit), mission teams require high-fidelity tools. Tools capable of visualizing real satellite motion with synchronized telemetry, live sensors, and historical trails.
Creating bespoke visualizations is time-consuming, resource-intensive, and demands rigorous validation for mission-critical precision. Compounding the challenge, few teams have the specialized engineering talent required to deliver high-performance 3D visualization, particularly in the browser. The result: a difficult tradeoff between building in-house or relying on off-the-shelf tools that lack flexibility, fidelity, or time-awareness.
Nominal Connect provides the answer – a Rust-based application framework for rapidly developing scientific visualization tools tailored to mission-grade satellite operations. It’s fast, high-resolution, time-aware, and engineered with precision for both web and native environments.
Real-time ephemeris in 3D
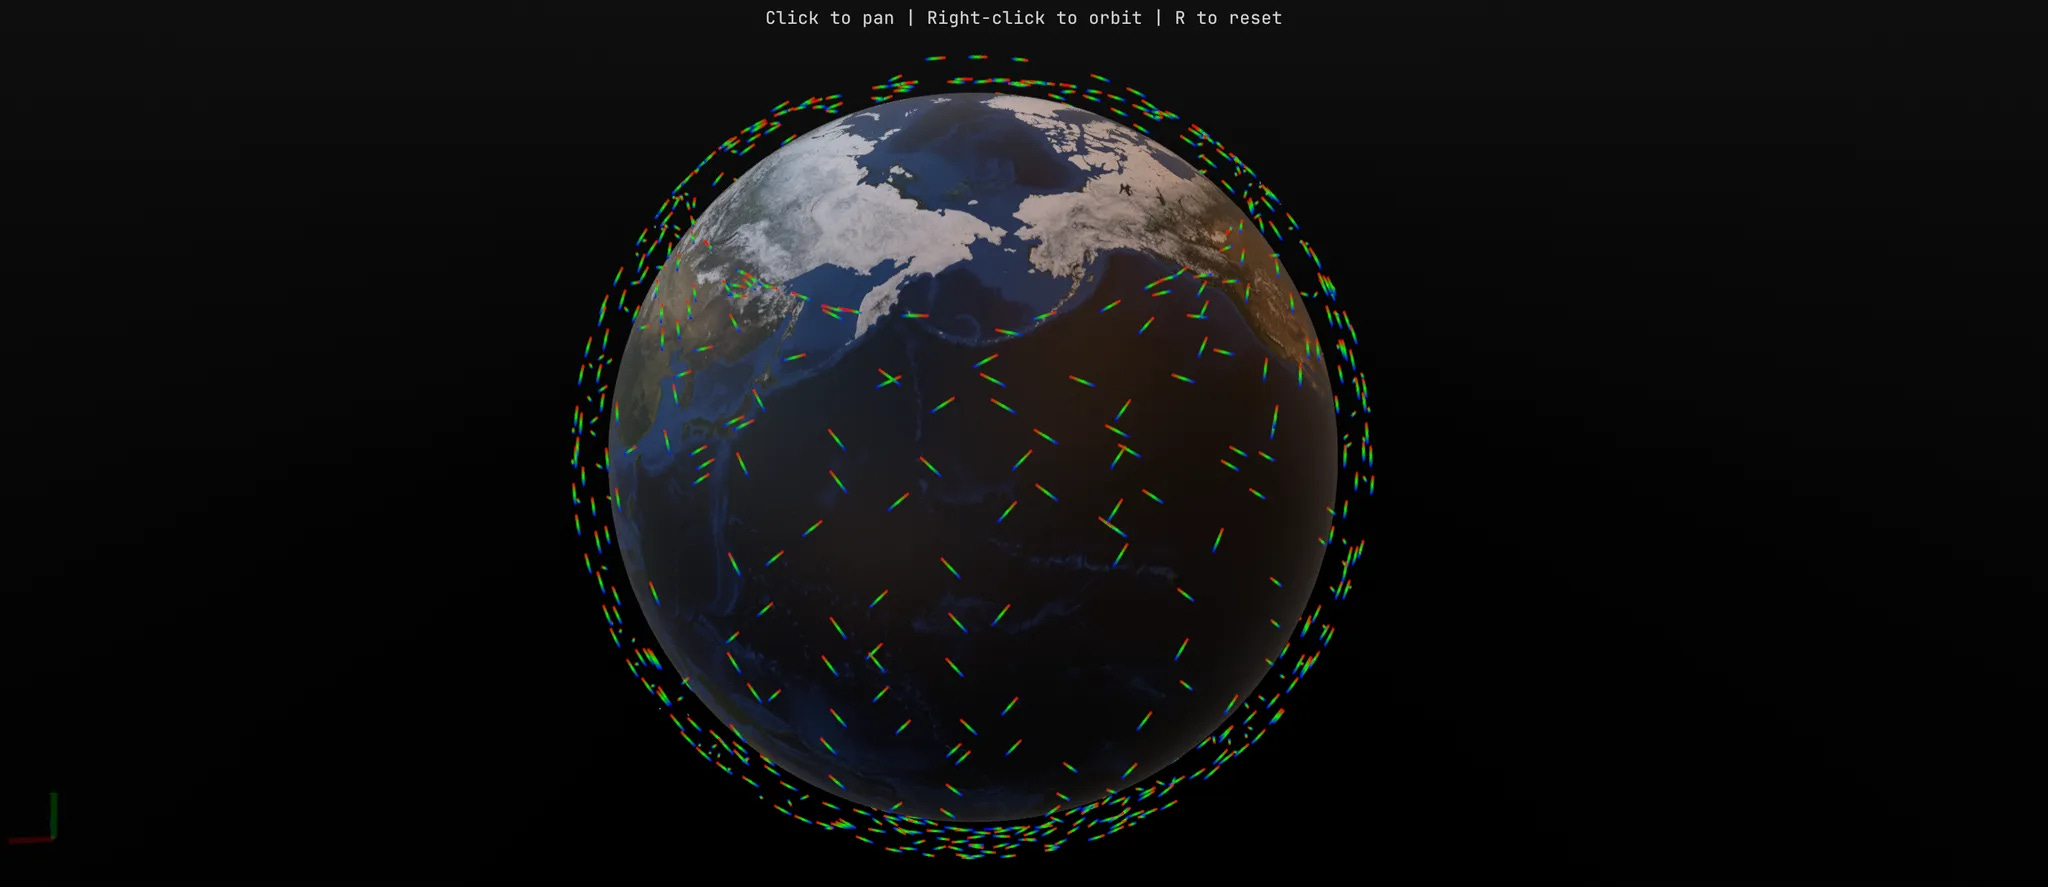
Nominal Connect can render satellite orbits in 3D using OEMs (Orbit Ephemeris Messages) and TLEs (Two-Line Elements). While TLEs are widely used for casual tracking, OEMs offer timestamped ground truth – essential for mission planning, historical replay, and validation workflows.
With Connect, you can:
Load orbital state from real or simulated OEMs
Scrub time forward or backward with millisecond precision
Visualize orbital paths as they evolve with physics-informed realism
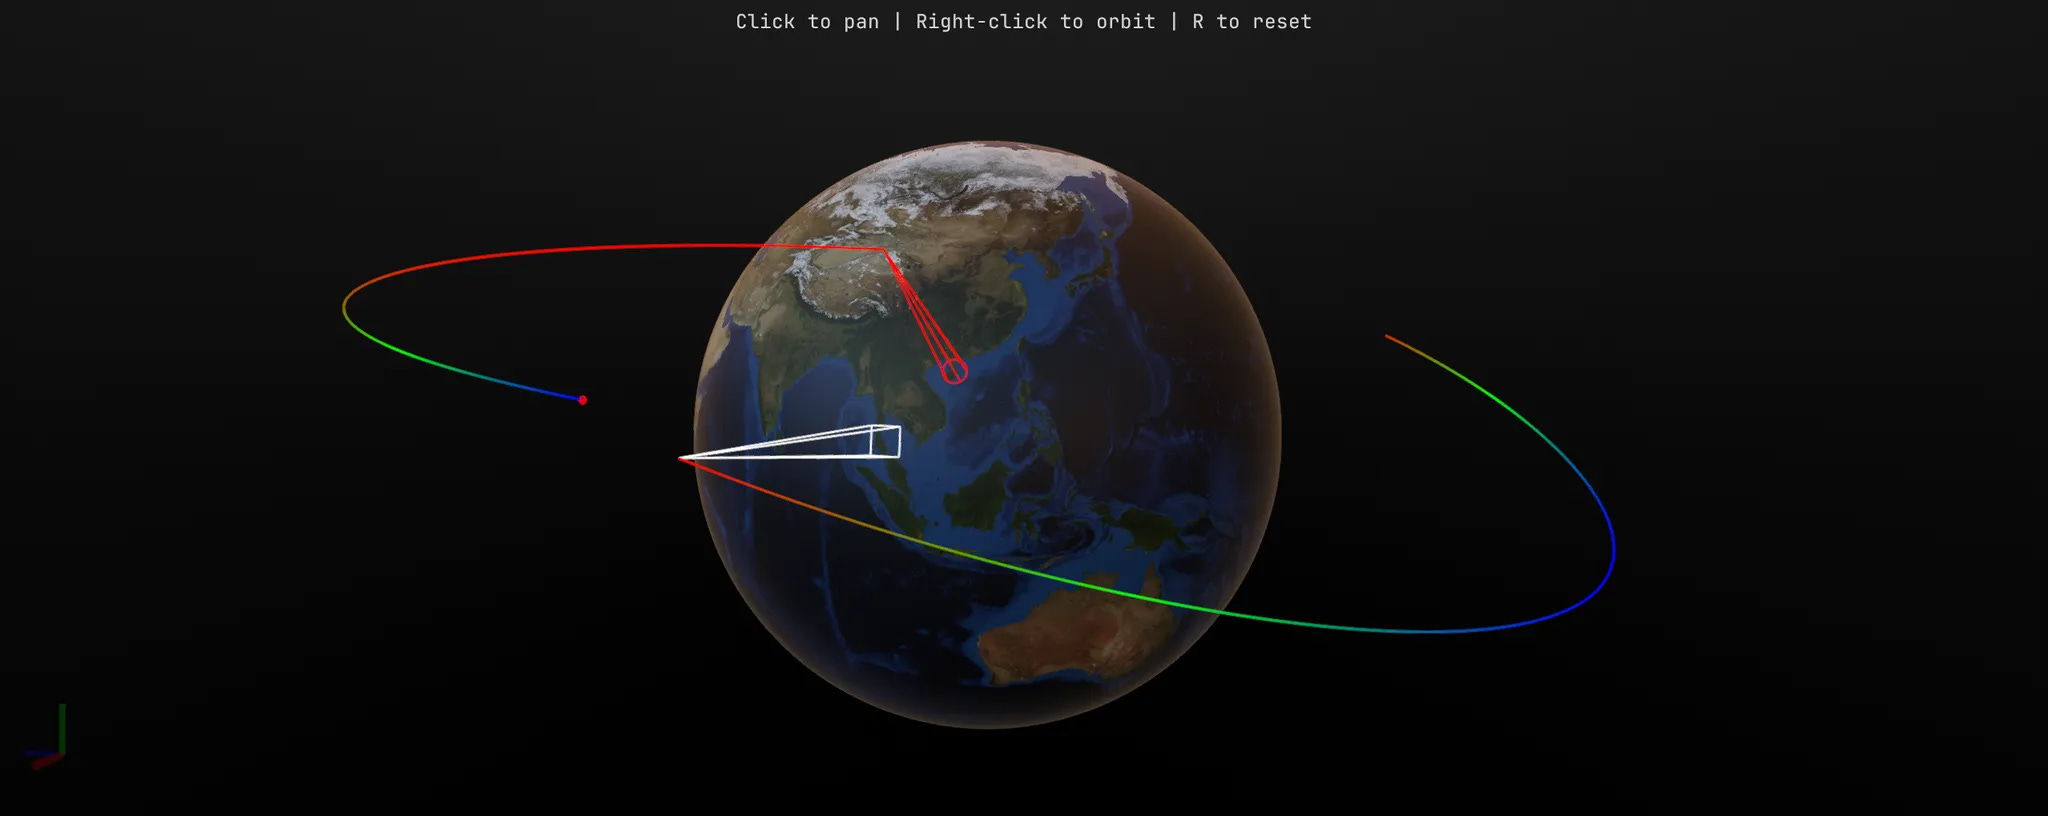
Every Connect application is powered by a declarative config file and Python scripts. The config file defines your scene – Earth, spacecraft models, sensors, stream colors, and more. The Python file connects your data to the visualization.
Connect works by opening a simple config file that describes your visualization:
scene:
  load_earth: true
  show_grid: false
  sensors:
  - iss_sensor:
      position:
        model: ISS
      orientation: nadir
      color: "#ffffff"
      shape: # Cone
        radius: 20000
        length: 408000
  models:
  - name: ISS
    path: ISS.glb
    scale: 0.1
    initial_altitude: 408000.0
    stream:
      id: iss
      color: "#00ff00"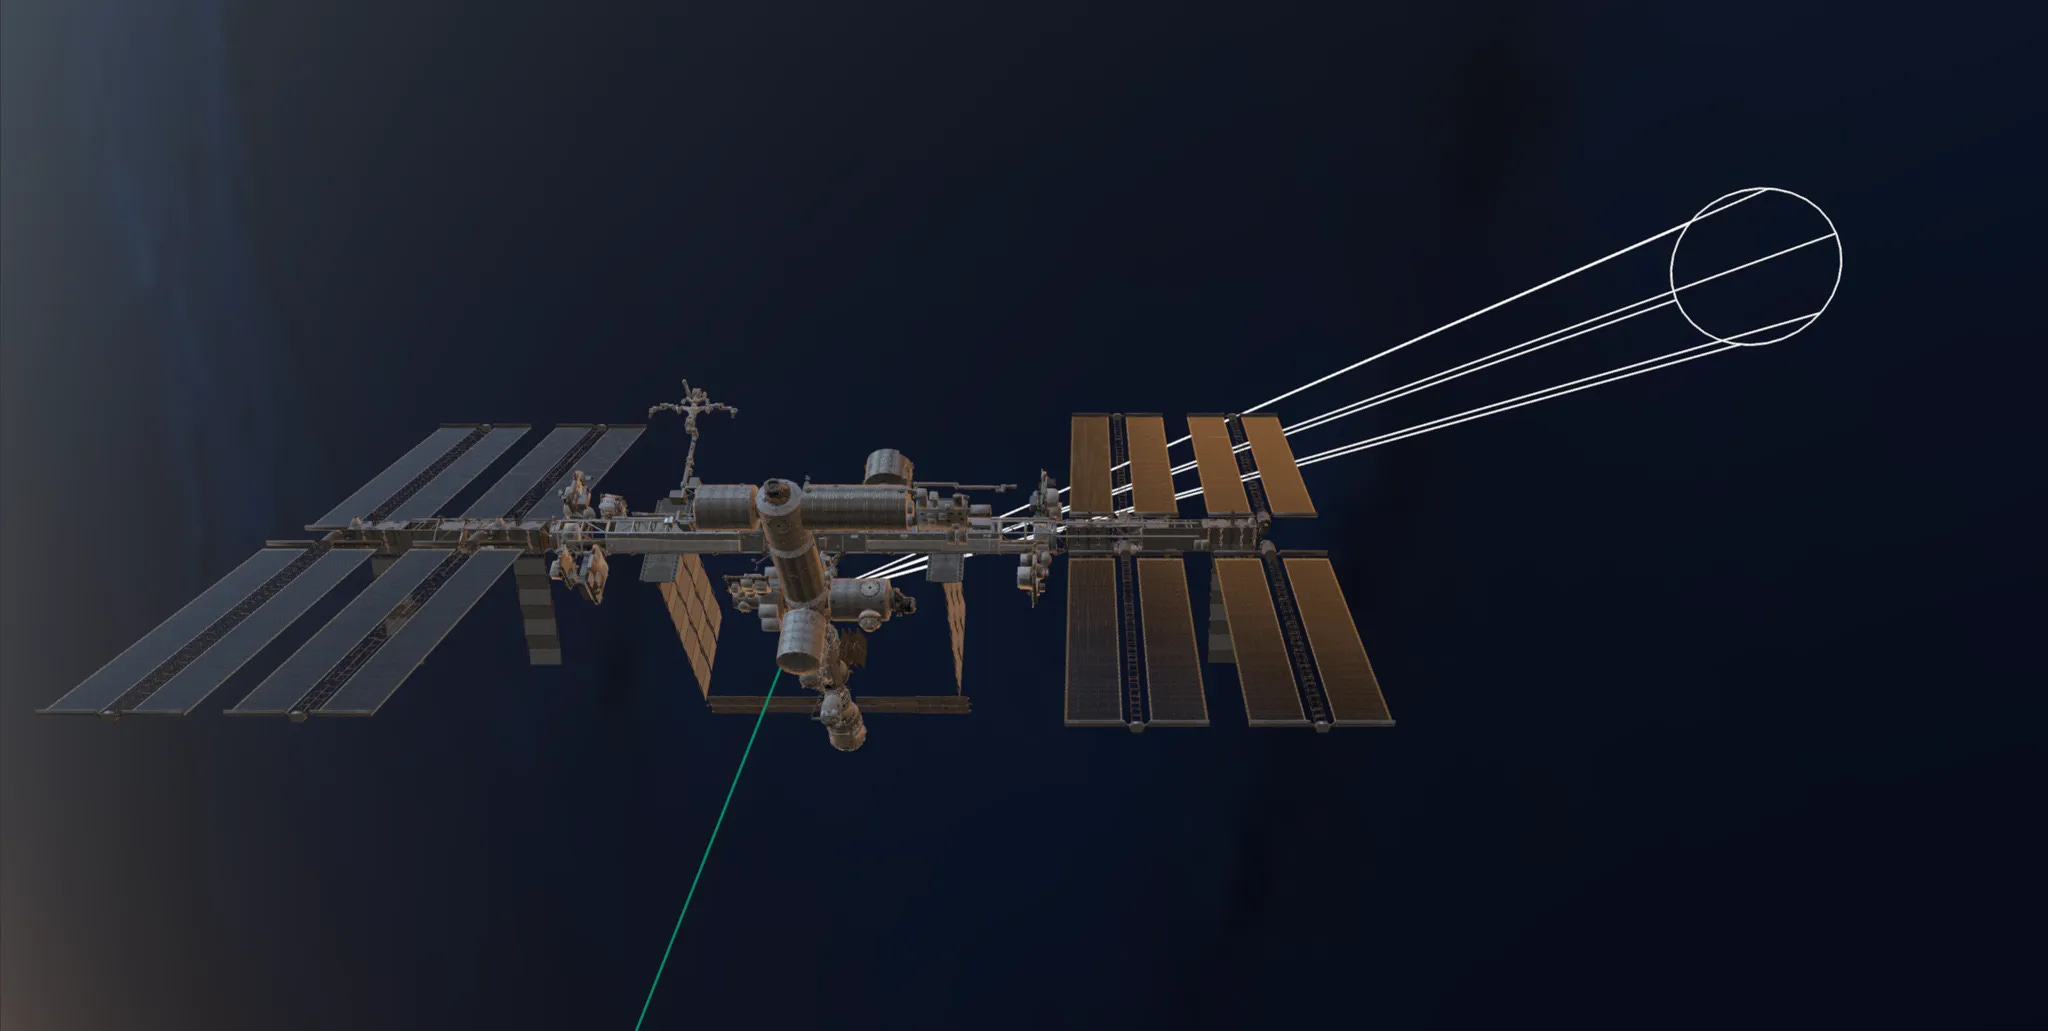
Connect’s runtime handles everything else: initializing the scene, managing python scripts, spinning up a performant GUI, and streaming data in real-time using a simple, intuitive Python client. As you stream position and attitude data – whether simulated or loaded from real telemetry – Connect renders it immediately in 3D, without sacrificing spatial or temporal precision.
import connect_python, time, math

@connect_python.main
def stream_data(client):
    timestamp = 0.0
    while True:
        timestamp += 0.01

        # Simulate position data
        lat = math.sin(timestamp) * 20         # Latitude oscillates ±20°
        lon = math.degrees(timestamp) % 360    # Longitude wraps around Earth
        alt = 420_000 + math.sin(timestamp * 50) * 15  # Altitude in meters

        client.stream(
            "sat1", timestamp,
            names=["latitude", "longitude", "altitude"],
            values=[lat, lon, alt]
        )

        time.sleep(0.01)  # Send data every 10ms
Connect offers flexibility in visualization configuration, and the Python runtime yields flexibility for business logic covering a wide variety of scenarios. It’s perfect for:
Replaying OEMs or TLEs
Simulating maneuvers or coverage
Driving real-time ops dashboards
Every Connect application can be packaged individually as a replay, making it useful for sharing with US government officials.
Precise time-syncing for precise missions
Every asset is synced with a global mission clock, because time isn’t just a parameter – it’s a constraint. Temporal precision affects everything: maneuver replay accuracy, sensor fusion, and decision-making clarity. Connect was built from the ground up to respect and preserve that fidelity. You can work in:
UTC
Relative mission time
Custom clocks tied to your own data systems.
Time becomes a first-class control. Pause, slow down, or jump forward. Connect’s real-time trail rendering engine lets you see object paths evolve, colored dynamically by telemetry values like velocity, attitude, or your own custom fields. This isn’t just visual polish – it’s mission context.
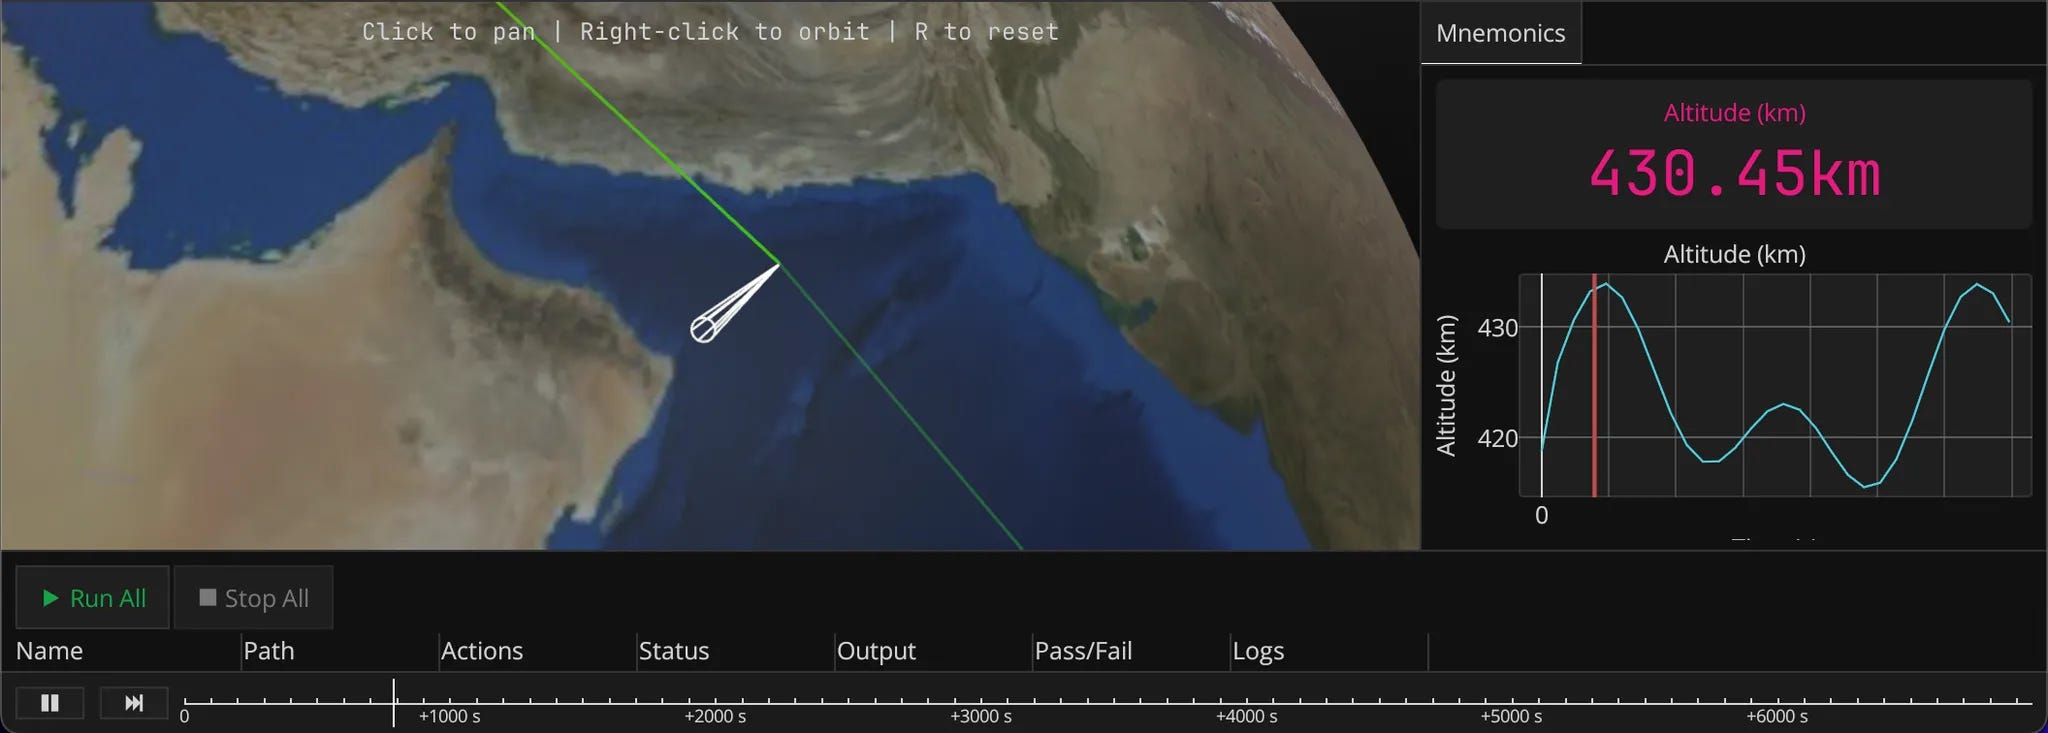
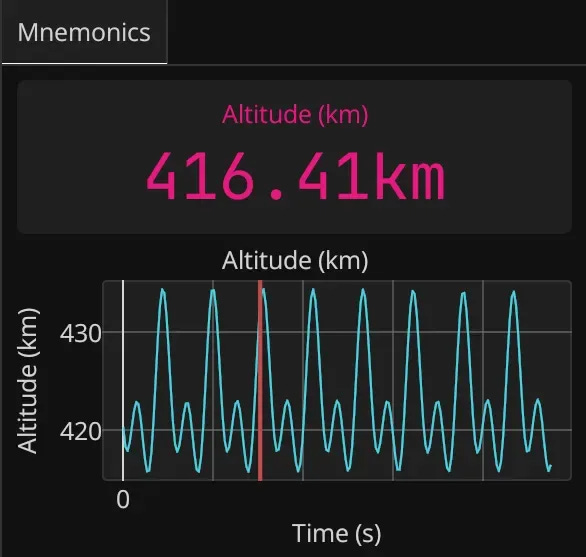
When you need more than visuals, Connect’s built-in time-series widgets let you plot any mnemonic in side-by-side panels – no browser extensions, no extra tooling. Click on a point in the graph, and the 3D scene jumps to that timestamp. It’s a direct, intuitive link between your data and your decisions. In space, precision isn't optional –and your tools shouldn't compromise on it.
right_panel:
  width: 0.2
  tabs:
  - name: Mnemonics
    layout:
    - display: stream_value
      title: Altitude (km)
      units: km
      stream_id: iss
      channel: alt_km
		...
Accelerate mission-grade visualizations
Stand up rich, mission-grade visualization tools in less time with Connect. Launch confidently, when precision is table-stakes and timelines are tight.
With Nominal Connect, you can:
Load OEMs, sensors, and telemetry with simple config files
Stream real-time data with Python
Scrub time, plot mnemonics, and render trails with precision
All in a system engineered for scientific fidelity, portability, and mission trust.